Enlarge screen ↗Example Cockpit screens · Fictional data · Detail view on mobile
FROM A NUMBER TO A CONVERSATION
Spend less time finding the question.
A regional result is the beginning. Cockpit helps you see the trend, compare the contributing work, and keep the follow-up connected.
Review performance
Examine the drivers
Assign follow-up
EXPLORE COCKPIT
Follow one margin concern. See how the work moves.
A regional service leader reviews a fictional month across Dallas and Fort Worth. Follow the four-step margin example, then explore revenue and customer health.
01 / Regional overview
See where the region needs you.
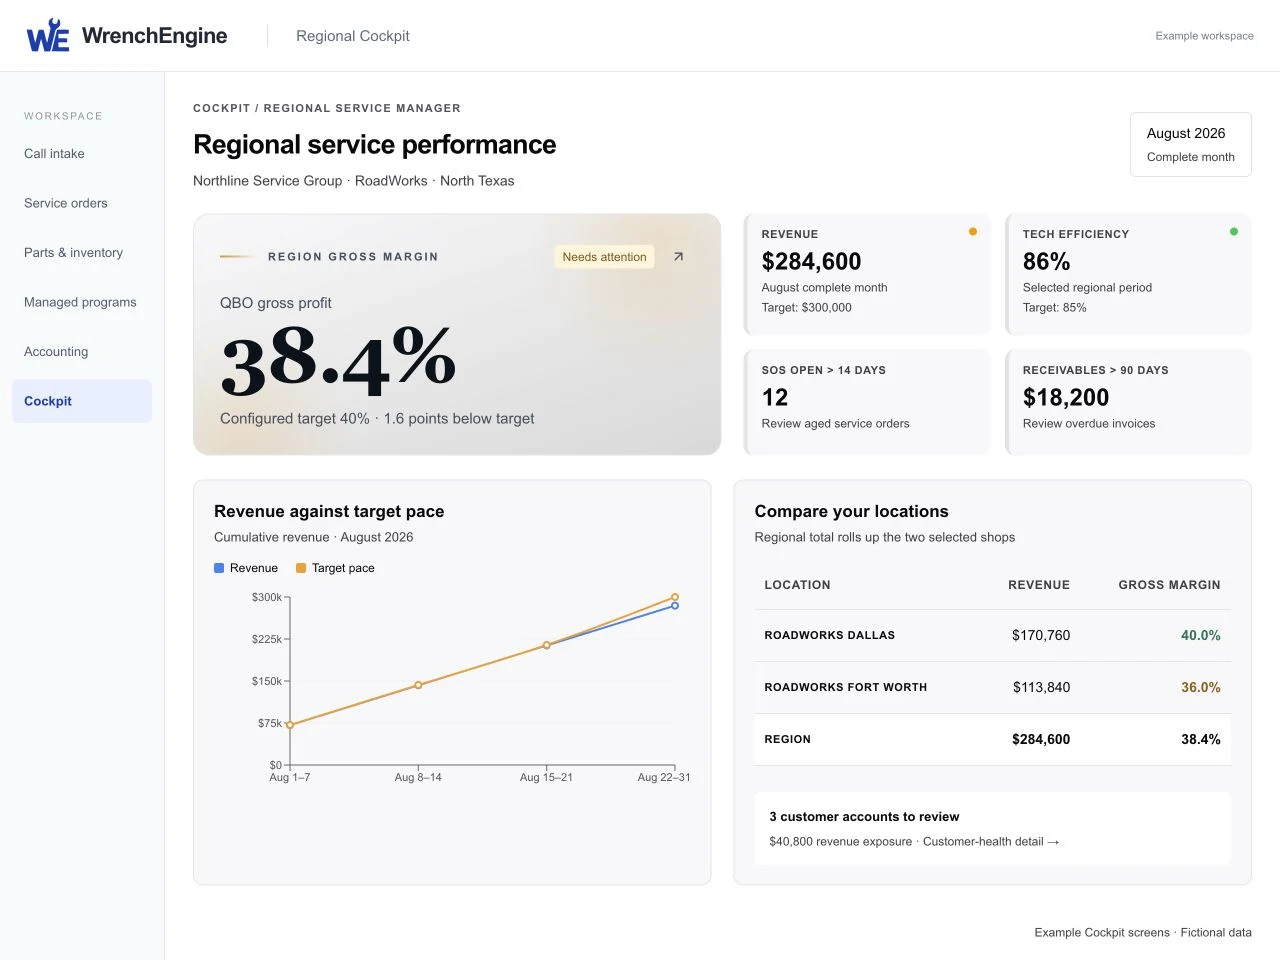
Start with the results you own. Revenue, gross margin, technician efficiency, and location performance bring the region into view.
Enlarge screen ↗Example Cockpit screens · Fictional data · Detail view on mobile
What to notice
Regional gross margin is 38.4% against a configured 40% target. Dallas is at 40%; Fort Worth is at 36%. Choose where to investigate before assuming a cause.
The next action
Open gross margin to see how income and costs changed over the period.
Gross margin is the share of revenue remaining after cost of goods sold. QBO means QuickBooks Online; SO means service order. Receivables are customer invoices still unpaid. Targets in this tour belong to the fictional operation.
02 / Gross-margin trend
See what changed behind the margin.
Follow income, cost of goods sold, and gross margin together. The trend gives a regional manager a starting point for a more focused conversation.
Enlarge screen ↗Example Cockpit screens · Fictional data · Detail view on mobile
What to notice
Each reporting bucket has $71,150 in revenue, while gross margin declines from 42% to 34%. Rising costs, not falling revenue, drive this example’s margin trend.
The next action
Open the service-line breakdown to narrow the investigation.
The example uses the QuickBooks profit-and-loss basis for income and cost of goods sold (COGS).
03 / Margin breakdown
Find the service line worth a closer look.
Compare the contributing service lines, then read the supporting figures. A clear breakdown helps the manager ask a specific question of the responsible team.
Enlarge screen ↗Example Cockpit screens · Fictional data · Detail view on mobile
What to notice
Mobile repair’s allocated margin is 34%, compared with 42% for shop repair and 44% for preventive maintenance. Investigate pricing, parts costs, and allocation; the estimate does not establish a cause.
The next action
Carry the selected metric and its context into a follow-up task.
Service-line margins are allocated cost estimates. They are not audited margins for individual repair invoices.
04 / Follow-up example
Give the finding an owner.
Keep the metric, period, and supporting context attached to the follow-up. Assign a person and a due date so the next conversation starts with the same evidence.
Enlarge screen ↗Example Cockpit screens · Fictional data · Detail view on mobile
What to notice
Jordan Lee owns the review, due September 11. The task keeps the 38.4% regional margin, 40% target, and mobile-repair concern attached to the next action.
The next action
The manager follows up with the owner and reviews the findings before deciding what to change.
This is a prefilled example screen. Exploring the tour does not create or assign a task.
05 / Revenue detail
See which locations are setting the pace.
Compare revenue with the plan for the selected period, then look at the locations contributing to the total.
Enlarge screen ↗Example Cockpit screens · Fictional data · Detail view on mobile
What to notice
The region finishes at $284,600 against a $300,000 target. Dallas contributes $170,760 and Fort Worth $113,840. Use pace and contribution together to focus the conversation.
The next action
Use the location comparison to focus a conversation with the manager closest to the work.
Revenue is not cash collected. The selected period and configured target give the comparison its meaning.
06 / Customer-health detail
Put customer follow-up in order.
See the accounts flagged for attention, their health changes, and the revenue associated with those relationships.
Enlarge screen ↗Example Cockpit screens · Fictional data · Detail view on mobile
What to notice
Cedar Freight moves from 76 to 54 in health score, with $18,400 of associated exposure. Across the 3 flagged accounts, $40,800 warrants investigation—not a write-off.
The next action
Have the responsible person investigate the concern and plan appropriate customer follow-up.
Revenue exposure is associated with flagged accounts; it is not confirmed lost revenue. Receivables are customer invoices still unpaid.
THE VIEW FOLLOWS THE RESPONSIBILITY
One region. Different work to own.
A regional leader compares locations. Each team needs the details that help it act within its assigned scope.
Review performance across locations and decide where management attention is needed.
Location service manager
Follow technician performance, open service work, and the operating priorities closest to the repair.
Parts and accounting teams
Follow inventory and purchasing work, or receivables and billing, through their own role views.
SEE YOUR OPERATION IN COCKPIT
Bring a question you chase today.
We’ll demonstrate the regional view, the details behind a metric, and how your team follows through. Cockpit is an optional upgrade; your proposal confirms the configuration.